 Measures for Distributors
Companies using Infor Distribution SX.e™ know that the application automates, captures and generates a wealth of data related to such items as sales, costs, margin and supply chain functions. The challenge is to move, analyze and leverage that data to make better business decisions. Measures for Distributors meets this challenge!
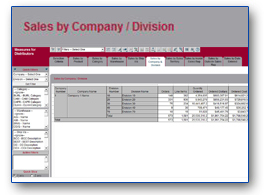
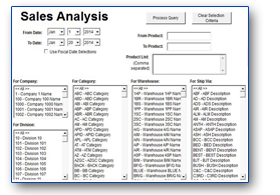
Developed specifically for wholesale distributors, Taurus’ Measures for Distributors unlocks the information you’ve been capturing in your production and operational systems, translates it into an easy-to-use format, and puts it within user’s reach. Dashboards, queries, and reports put information into a dynamic view – complete with charts, graphs, and full-pivot tables. Even create your own custom queries to make more timely decisions or share data while it is still relevant.
Learn how Measures for Distributors can provide instant access to your critical SX.e data by attending one of our free webinars.

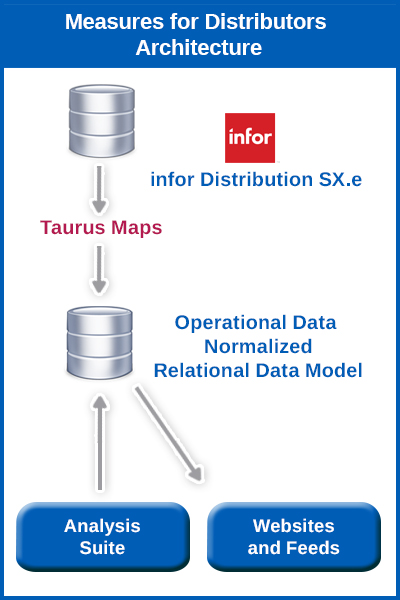
Measures for Distributors is the way to quickly and easily analyze and maximize Infor SX.e and other databases used by your organization. Measures for Distributors replicates and transforms your Infor SX.e data into a relational database optimized for analysis. That environment includes ready-to-use dynamic queries which allow business users to easily mine the wealth of data captured and generated by Infor SX.e – with little to no help from IT staff.
 Why an Infor Distribition SX.e Site would want Measures for Distributors
Business users aren’t getting all of the information
they need about the business in the format they require
- • Standard Production reports are cumbersome and not targeted for each specific user’s needs
-
• Users can’t do on the fly analysis with reports they have access to
- • Users must rely on IT to build reports instead of building them on their own
- • Reports are often static and users can’t drill down to determine the cause of the problems they are searching for
- • Data Integrity and the lack of reporting standards doesn’t ensure accurate reporting throughout the organization
- • Report runs may impact production, so can’t be scheduled as often as desired
- • Users spend time building spreadsheets because they must manually assemble data from disparate sources
-
Measures for Distributors’ centralizes a company’s data
- Eliminates silos of data and conflicting results and analysis – Measures for Distributors creates an open environment allowing data to be merged alongside Infor SX.e to create a single consolidated corporate wide data store providing a single version of the truth. Underlying details allow users to drill to raw figures to prove accuracy of results.
- New query technology can be used against the ODS – not against Progress. Dashboards using tools like Tableau or LogiXML, or dynamic analysis using Hyperion can all be used against the ODS but not against the production data structures.
- Production Performance Impact
- Faster and More Dynamic Analysis
- Better Quality of Analysis
- Partial Query List
Production Performance Impact
- • Provides reporting without impacting system performance
- • Users will no longer be limited by when they can run reports waiting for overnight runs or during low volume times
- • Reports can be run on demand, as frequently as the business user requires
- • Ability to run reports during system downtime
 Faster and More Dynamic Analysis
- • Queries run faster against ODS because designed for analysis – can index as desired
- • Users can do “on the fly” analysis – don’t know next question until answer first – no longer need to wait for new report to be built to answer next question
- • Business users can build their own analysis – No need to request custom reports from IT, freeing staff to focus on other projects
- • Decrease development time for custom or new reports
- • Able to view multiple versions of reports from one main screen
- • Flexible sorting and selection criteria – using same data can get different views
- • Drill down options allow additional columns and data to be added on the fly
 Better Quality Analysis
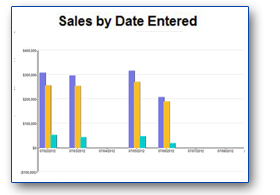
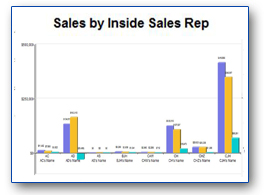
- • Provides operational reporting in easy to read graphs, charts or dashboards. This is something Infor SX.e does not have.
- • View reports easily online, print or export to other documents in one keystroke.
- • Eliminates the need for manual spreadsheets –pivot tables created behind the scenes are easily accessible.
- • Provides access to information without having to understand Infor SX.e database or Progress.
- • Easily deploy data/reports via email or intranet.
- • Single view of data …no need to combine spreadsheets from multiple reports.
- • Ability to map/import data from all system sources.
- • Analyses include user friendly table names, columns and description of codes.
 Partial analysis list designed with
the business user in mind, such as:
Partial analysis list designed with
the business user in mind, such as:
- • Product Sales Analysis
- • Category Performance Analysis
- • Company and Division Performance Analysis
- • Territory Performance Analysis
- • Inside and Outside Sales Rep Performance Analysis
- • Inventory Position Analysis
Benefits of Measures for Distributors
Join a community of other sites that successfully use Taurus’ Measures Products because they:
- • Yield almost immediate results for improved business intelligence
- • Include a suite of pre-built business queries
- • Take the reporting load off of your production environment
- • Can be augmented with other data sources
- • Have an open design with ability to expand as you need it
- • Potentially act as a source for websites
Measures for Distributors Includes:
- • DataBridger to move data from Infor SX.e into the Measures Operational Data Store
- • Maps for Distributors, the “blue print” of how data is transformed
- • Hyperion for up to 25 users
- • Suite of pre-built queries
- • Taurus data load/installation services
- • Training for your business users and IT staff